Is PRAUC the gold standard for AML model performance?
Is my AML model effective in practice? And what’s the best way to answer that question?
Research from PwC reveals why: 90-95% of AML alerts turn out to be false positives, with large institutions generating 950 false alerts daily per million transactions. A model can score 0.95 on ROC AUC and yet still overwhelm your team.
PRAUC (Precision–Recall Area Under the Curve) cuts through this. It measures: Recall (are you catching threats?) and Precision (are alerts worth investigating?). It’s the metric that links model performance to operational reality.
Here’s why that’s key and what it means for how you measure AML success.
The importance of the right AML metrics
Performance metrics shape how effectively an entire AML program operates. In most banks, fewer than 1 in 1000 transactions flagged by a monitoring system leads to a SAR. That imbalance means false positives dominate workloads. Each alert still demands analyst attention, even when it leads nowhere.
So, when compliance teams talk about model performance, they’re trying to understand whether a model helps them make better use of limited human resources.
Choosing the wrong metric can distort that view.
- ➡A model with a high “accuracy” score can still be useless in practice if almost all cases are legitimate customers behaving normally.
- ➡A model that looks strong might still leave regulators questioning its effectiveness if it misses rare but critical patterns of suspicious activity.
That’s why financial crime detection needs measures that reflect how AML really works: scarce positives, expensive investigations, and high regulatory expectations.
PRAUC makes that connection, translating complex model behaviour into what matters most for regulators and investigators alike: are we finding the right cases, and are we doing it efficiently?
AUC in plain terms: judging model quality across thresholds
As you’re probably well aware, every AML model produces a score, a probability that a customer, transaction, or case might be suspicious. To turn those scores into alerts, banks set a threshold: everything above it gets reviewed; everything below it doesn’t.
But thresholds aren’t fixed. They vary between institutions and change as risk appetite, regulatory expectations, or investigative capacity shift. That makes it difficult to judge a model’s quality based on one threshold alone.
That’s where AUC, or Area Under the Curve, comes in.
Instead of assessing performance at a single threshold, AUC measures how a model performs across all possible thresholds. It captures the overall relationship between true positives and false positives, essentially, how well the model separates “good” from “bad” cases, no matter where you draw the line.
There are two common AUC measures:
- ➡ROC AUC (Receiver Operating Characteristic): the traditional choice in many machine learning applications.
- ➡PR AUC (Precision–Recall): the metric is increasingly favored in contexts like AML, where the number of true suspicious cases is extremely small compared to legitimate ones.
Both use recall (how many true positives are found), but they frame performance differently, and that difference becomes critical when positives are rare.
To see how these measures differ in practice, consider the example below. Both charts show the same AML model evaluated on data where only 0.01% of activity is truly suspicious. The ROC curve shows solid performance 0.96 ROC. At the same time, the PR AUC curve shows a model struggling to wade through the noise, with near-zero precision-recall.
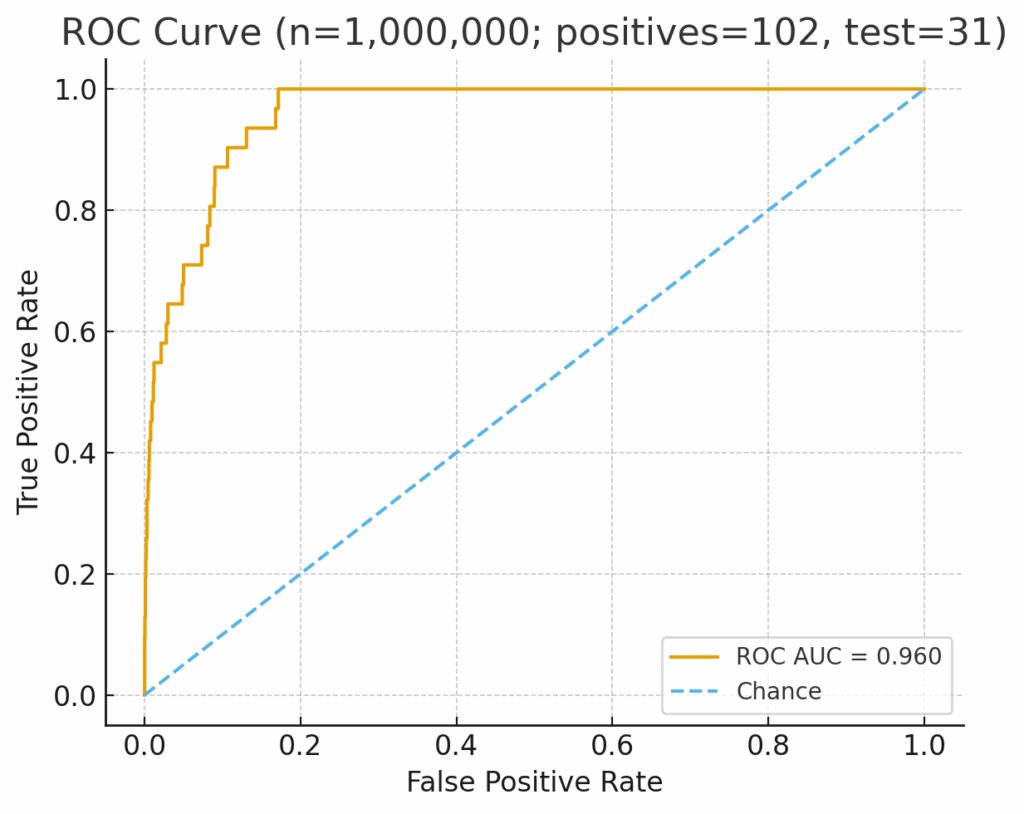
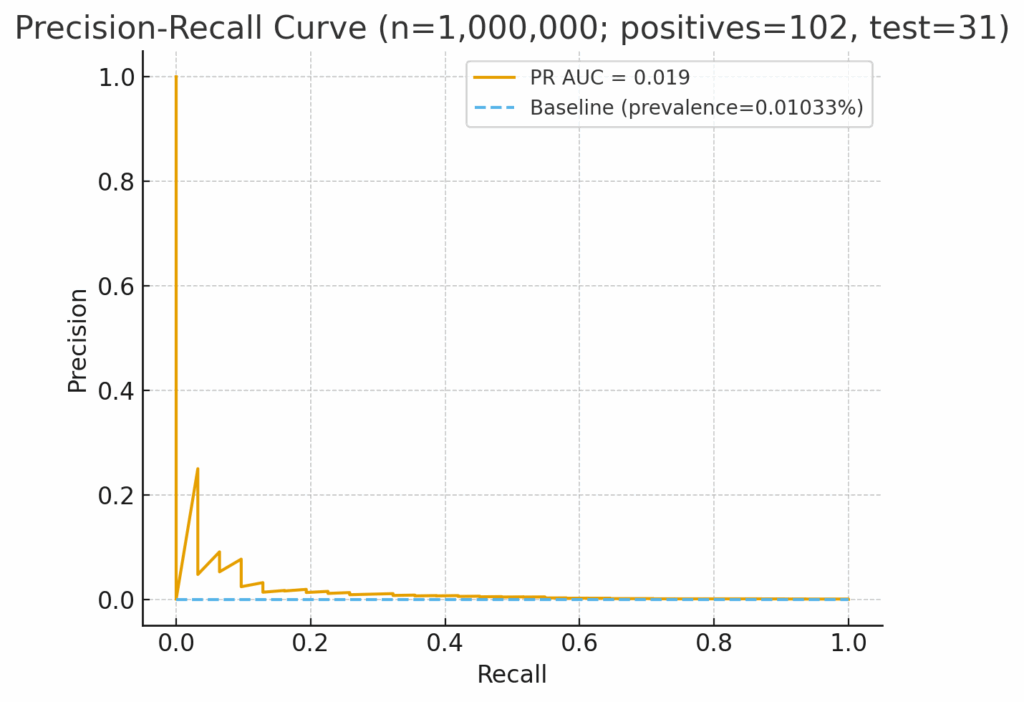
The difference: PRAUC shows how the model actually performs in the field.
Let’s break this down further.
ROC AUC vs PRAUC: same goal, different reality
At first glance, ROC AUC and PR AUC seem to measure similar things. Both consider how well a model identifies true positives. Both reward higher recall. But they differ in what they measure against recall.
ROC AUC (Receiver Operating Characteristic)
- 🟣Plots True Positive Rate (Recall) against the False Positive Rate.
- 🟣The False Positive Rate measures how many legitimate cases were incorrectly flagged out of all legitimate activity.
- 🟣In balanced datasets, this is fine. But in AML, where almost every transaction is legitimate, even a small proportion of false positives creates a massive workload.
PRAUC (Precision–Recall)
- 🟣Plots Precision (how many flagged cases were actually suspicious) against Recall.
- 🟣Instead of focusing on the total number of false positives, it focuses on the quality of positive predictions: the alerts investigators actually have to review.
- 🟣This makes it far more realistic in contexts where “positives” are extremely rare, and investigation time is a scarce resource.
ROC AUC vs PRAUC at a glance
| Metric | What it measures | When it works best | Limitation in AML |
| ROC AUC | Plots True Positive Rate (Recall) vs False Positive Rate | Balanced datasets with similar numbers of positive and negative cases | Overestimates model quality when suspicious cases are rare. They can look “good” even if most alerts are false positives |
| PRAUC | Plots Precision vs Recall | Highly imbalanced datasets (like AML) where true positives are scarce | Provides a clearer picture of model effectiveness, combining regulatory coverage (recall) with investigator efficiency (precision) |
Both metrics have their place. But when evaluating AML models, where the signal is rare and the cost of noise is high, PRAUC tells the truer story.
Why PRAUC reflects AML reality
In financial crime detection, success depends on satisfying two very different audiences.
Regulators want to know you’re catching the threats that exist in your data. That’s recall: the percentage of true suspicious cases your model identifies.
Investigators want to know if the alerts they review are worth their time. That’s precision: the percentage of flagged cases that turn out to be genuinely suspicious.
Other AML metrics don’t directly measure and combine these two concepts. ROC AUC measures False Positive Rate rather than Recall, which is related but differs depending on the sample bias. PRAUC measures both, which is exactly why it reflects operational reality better than traditional alternatives.
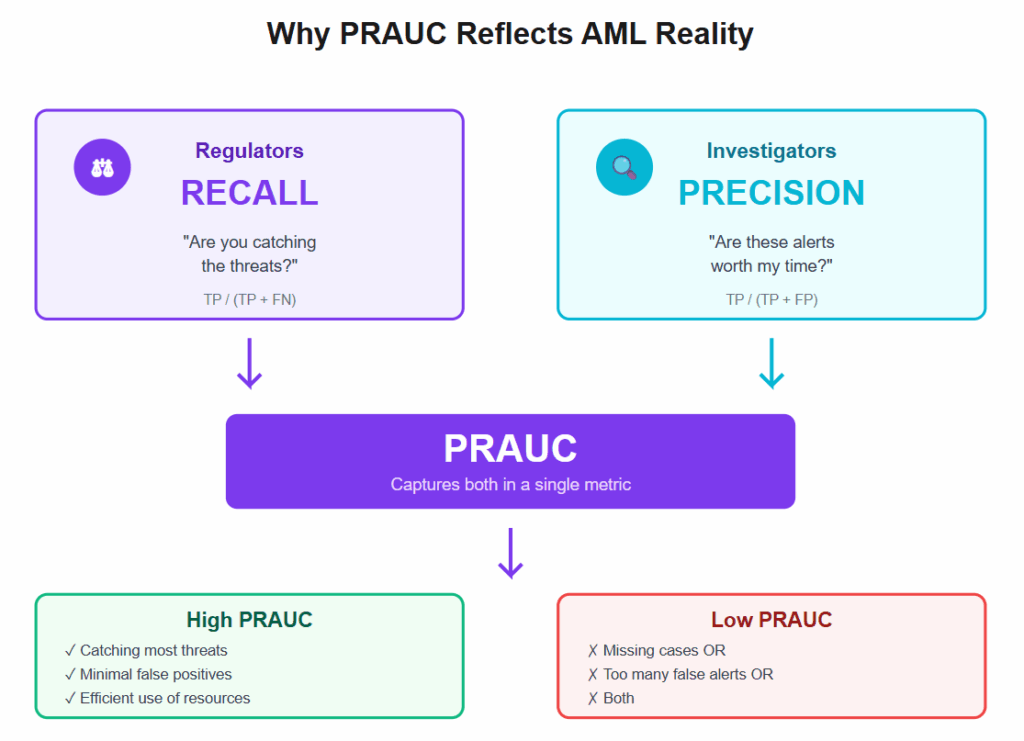
Unlike ROC AUC, which can give a flattering view of model performance even when positives are rare, PRAUC forces the model to earn its score through beneficial results. It rewards models that surface more true suspicious activity without flooding analysts with false leads.
What high PRAUC performance looks like
PRAUC demonstrates how well a model performs in the real world.
When PRAUC is high, you can see the difference across the entire AML process:
- 🟣Investigators review fewer alerts, but find more of value.
- 🟣SAR conversion rates rise as the proportion of meaningful cases increases.
- 🟣Feedback loops improve because analysts are spending more time on cases that refine the model rather than correcting noise.
When PRAUC is low, the opposite happens:
- 🟣Investigators spend hours chasing dead ends.
- 🟣Genuine suspicious activity slips through the cracks.
- 🟣Models appear to perform well statistically but fail to improve real-world outcomes.
How it looks in practice
| Scenario | Model Output | Investigator Experience | Likely PRAUC |
| 📈High PRAUC | Alerts are fewer and higher quality | Analysts see patterns worth escalating; stronger SAR conversion | High |
| 📉Low PRAUC | Alerts are frequent and mostly false | Analysts lose confidence; feedback quality deteriorates | Low |
High PRAUC models drive a virtuous cycle: more meaningful alerts → better feedback → stronger models → improved recall and precision over time. Plus, as well as scoring well in testing, they make the day-to-day work of AML more sustainable and defensible.
Aligning PRAUC with regulatory expectations
Supervisors have made it clear that AML programs must demonstrate effectiveness. Regulators want evidence that systems are finding genuinely suspicious activity and using resources proportionately.
That’s where PRAUC becomes particularly useful.
Because it captures both recall (coverage of true positives) and precision (quality of those positives), PRAUC provides a single, interpretable metric that connects directly to what regulators are asking for:
- ➡Measurable outcomes. How well does the model identify true suspicious activity?
- ➡Operational proportionality. Is investigator time being used efficiently?
Used alongside governance metrics such as case-handling times, PRAUC offers a defensible way to show progress toward effectiveness.
For validation teams, it can also help benchmark performance across multiple model iterations or peer institutions, particularly in collaborative environments like federated learning, where anonymised comparisons can highlight what “good” looks like without sharing underlying data.
In short: PRAUC aligns statistical evaluation with regulatory language by connecting model validation to the operational and compliance outcomes that ultimately define success.
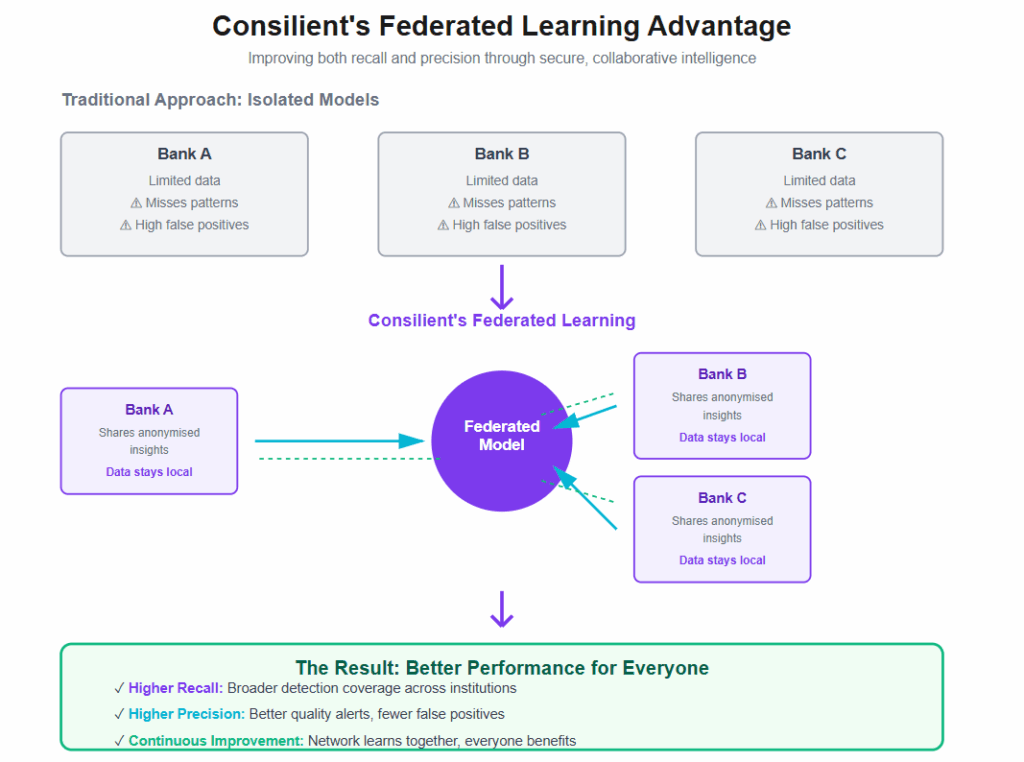
Consilient’s perspective
At Consilient, we view AML model performance through the same lens that regulators and investigators do, balancing effectiveness with efficiency.
Our federated learning approach allows institutions to strengthen both. By securely combining intelligence across banks, MSBs, and other reporting entities, each participant benefits from broader detection coverage (recall) without sacrificing alert quality (precision).
This same principle underpins how our models are trained and validated:
- 🟣They are designed to maximise recall of suspicious activity while maintaining a high standard of precision. This ensures that investigators’ time is directed toward the most meaningful cases.
- 🟣They are continuously retrained using anonymised, shared insights so that improvements in one institution strengthen performance across the network.
While there are many ways to measure a model’s performance, we focus on the outcomes that matter most: more accurate detection, fewer false positives, and a demonstrable link between model outputs and real-world AML effectiveness.
The result: models that not only perform well statistically but deliver measurable improvements in compliance outcomes and investigator productivity.
The right AML metric for meaningful progress
To sum up, AML model performance is about measuring what truly improves outcomes. Metrics like ROC AUC can make models look effective, even when they generate more work than value.
PRAUC, by contrast, captures the full picture. It reflects how well a model identifies genuine suspicious activity and how efficiently it uses investigator time. It balances regulatory recall with operational precision: the two dimensions that define effectiveness in modern AML.
As expectations rise and the pressure to evidence results grows, PRAUC offers a practical way to prove that progress is real.
See how Consilient’s federated learning models improve both recall and precision, helping financial institutions demonstrate effectiveness while reducing investigative workload. 👉 Let’s talk